Genomic selection
Identification of genes resistance for Viral Nervous Necrosis in the European Sea bass
Whole genome sequencing technology allowed fine mapping of the Viral Nervous Necrosis (VNN) resistance phenotype in European sea bass (Dicentrachus labrax).
Combining high-throughput sequencing data, medium-density genotyping data (~57K SNPs markers) and phenotypic data, allowed to unravel a strong association between a quantitative trait locus (QTL) in linkage group 12 (LG12) and sea bass survival in the face of VNN infection (Figure 1; Delpuech et al. 2022).
From the available Sea bass genome annotation, we were able to identify two genes of interest (ZDHHC14 and IFI6). This reveals the major role of a protein induced by an interferon in the survival mechanisms of VNN wich is a considerable advance in the field.
Hatcheries facilities can now use this knowledge to improve the genomic selection of their lineages in order to develop more resistant bars.
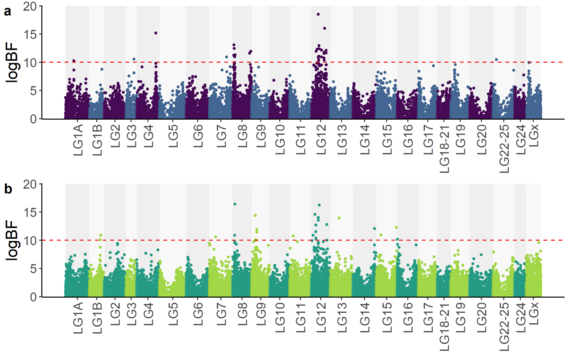
Figure 1 from Delpuech et al. (2022), bioRxiv.
Manhattan plot representing the genetic-phenotype associations obtained from the study of VNN resistance in European sea bass.
Studies of genetic values for the selection of traits of interest
Genomic selection has been used to improve many traits of interest with high heritability. For example, this type of approach has been successfully applied to many farmed species, and recently to aquaculture species for pathogen resistance. It has allowed a genetic gain of 12.5% on average per generation for resistance to different diseases. Genomic selection is therefore a promising approach to control diseases affecting both wild and domestic populations (Griot et al. 2021).
On the other hand, Aliakbari et al. 2021 highlighted similar genomic prediction using either (i) a so-called training set comprising animals of genetically related lines or (ii) a training set from the target population. Furthermore, in cases where it is possible to combine related data with data from the target population, the accuracy will only increase for traits (Figure 3).
These quantitative genetic results provide better knowledge for designing reference populations, especially for initiating genomic selection in populations where the number of historical samples is low.
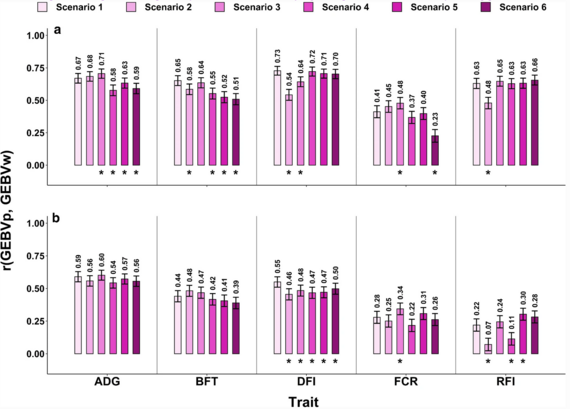
Figure 3 from Aliakbari et al. (2021).
Correlations between GEBVp and GEBVw, and their error bars for the HRFI (a) and LRFI (b) lines.
*=Significant difference with scenario 1 (control) according to Williams t-test at 0.05 level.
RFI=residual feed intake, ADG=average daily gain, FCR=Feed conversion ratio, DFI=daily feed intake, BFT=backfat thickness
Let’s discuss your project
Do you wish to implement biodiversity monitoring, study a population, or develop a specific molecular tool ?